
Charting
View coins against our indicators and draw right on the chart.
Built for altcoins, not just Bitcoin — and it hands you a conclusion, not just raw charts.
Trading crypto since 2013, we built the terminal we always needed: heat meters, cycle signals and sentiment — the whole market on one screen.
No card · $0 forever · read-only — never touches your funds
Advanced Analytics
The exact same professional-grade indicators our team opens every day. Below is an interactive preview on sample data — sign in for the live reading.
Where capital is rotating — BTC, ETH, alts or cash.
Retail FOMO gauge — climbing ranks signal late-cycle.
Calibrated across every cycle
The Bitcoin Heatmeter folds 14 indicators into one score — one glance a day tells you which regime you're in, no chart-staring required. Check it against the dates yourself:
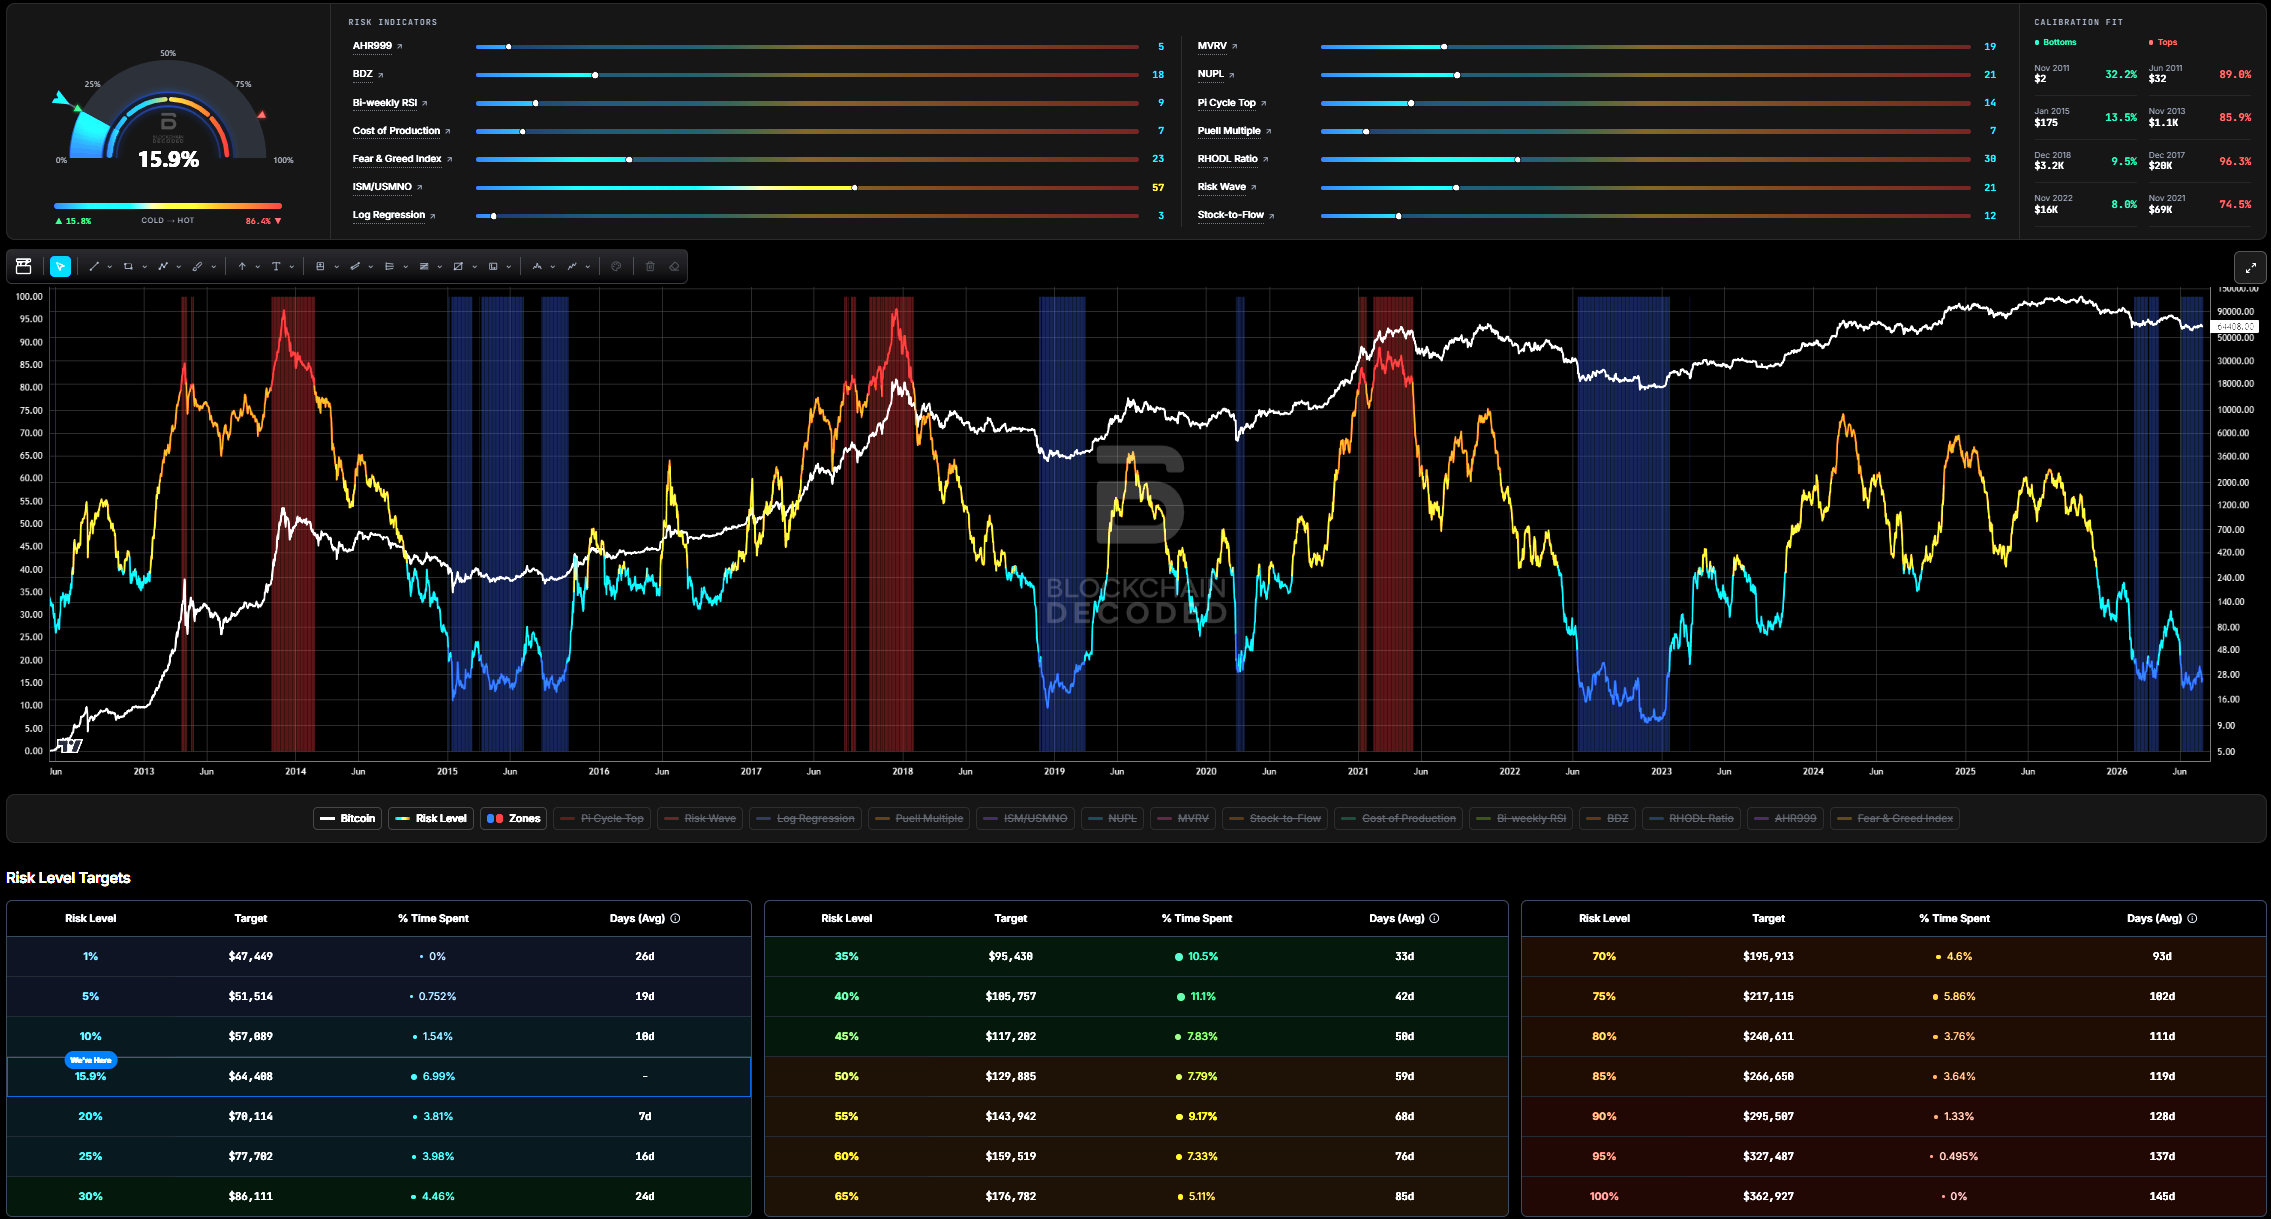
Composite of 14 on-chain and market indicators, calibrated against every prior Bitcoin cycle. Not financial advice.
Open the HeatmeterWhy it nails these dates: the score was tuned on them — that's the calibration, not a prediction it made at the time. The next cycle is the real test, and that's exactly what the live meter is for.
The real Pattern Analyzer, running on a real BTC snapshot — every match overlays where history went next.

After navigating every market cycle since 2013, I know how costly emotional trading can be. Blockchain Decoded gives you the same professional indicators I use — heat meters, cycle indicators, and liquidity flows — so you can time the market with data, not gut feelings.
Inside the terminal
View coins against our indicators and draw right on the chart.
The one score from above, in full — every indicator, its weight and its history.
On the roadmap
Pricing
14-day money-back guarantee on all paid plans.
FOREVER
Billed annually ($290) · Save $58/yr
Billed annually ($590) · Save $118/yr
ONE-TIME
First 10 members at this price
then $1,500 → $2,000
CANCEL ANYTIME
Frequently Asked Questions
Blockchain Decoded is a Web3 dashboard designed to help you track market sentiment, monitor key crypto indicators, and make smarter trading or investing decisions — all in one clean interface. It helps you analyze whether it's a good time to buy or sell Bitcoin and altcoins, based on the most battle-tested metrics and indicators.
Anyone involved in crypto. Whether you're a beginner exploring the space or an experienced investor, this dashboard gives you a clear overview of what's happening in the market. We've made it easy for beginners to understand, while providing enough data for advanced crypto users to find valuable insights.
You don't need to watch charts all day. The heatmeters compress everything into one score — a quick glance tells you whether the market is running cold (historically accumulation territory), neutral, or hot (time to be careful). The indicators are refreshed on a regular schedule, so checking in once a day is enough to catch a regime change.
Into the Cryptoverse was designed by Benjamin Cowen, who has less focus on altcoins. While it partly inspired Blockchain Decoded, we noticed that Ben's website has outdated information and isn't really focused on altcoins. We make it easier for beginners and provide (limited) conclusions instead of just raw data.
Together with a great development team and crypto experts, Menno van Ravels (Fomotion) is the main face behind the platform. Fomotion started his crypto journey in 2013 and launched a crypto YouTube channel in 2021.
Get started
Start free — no card required — and upgrade anytime for the full toolset.
No card · $0 forever · read-only — never touches your funds
Analytics only. We never touch your funds or private keys.
